 Servflow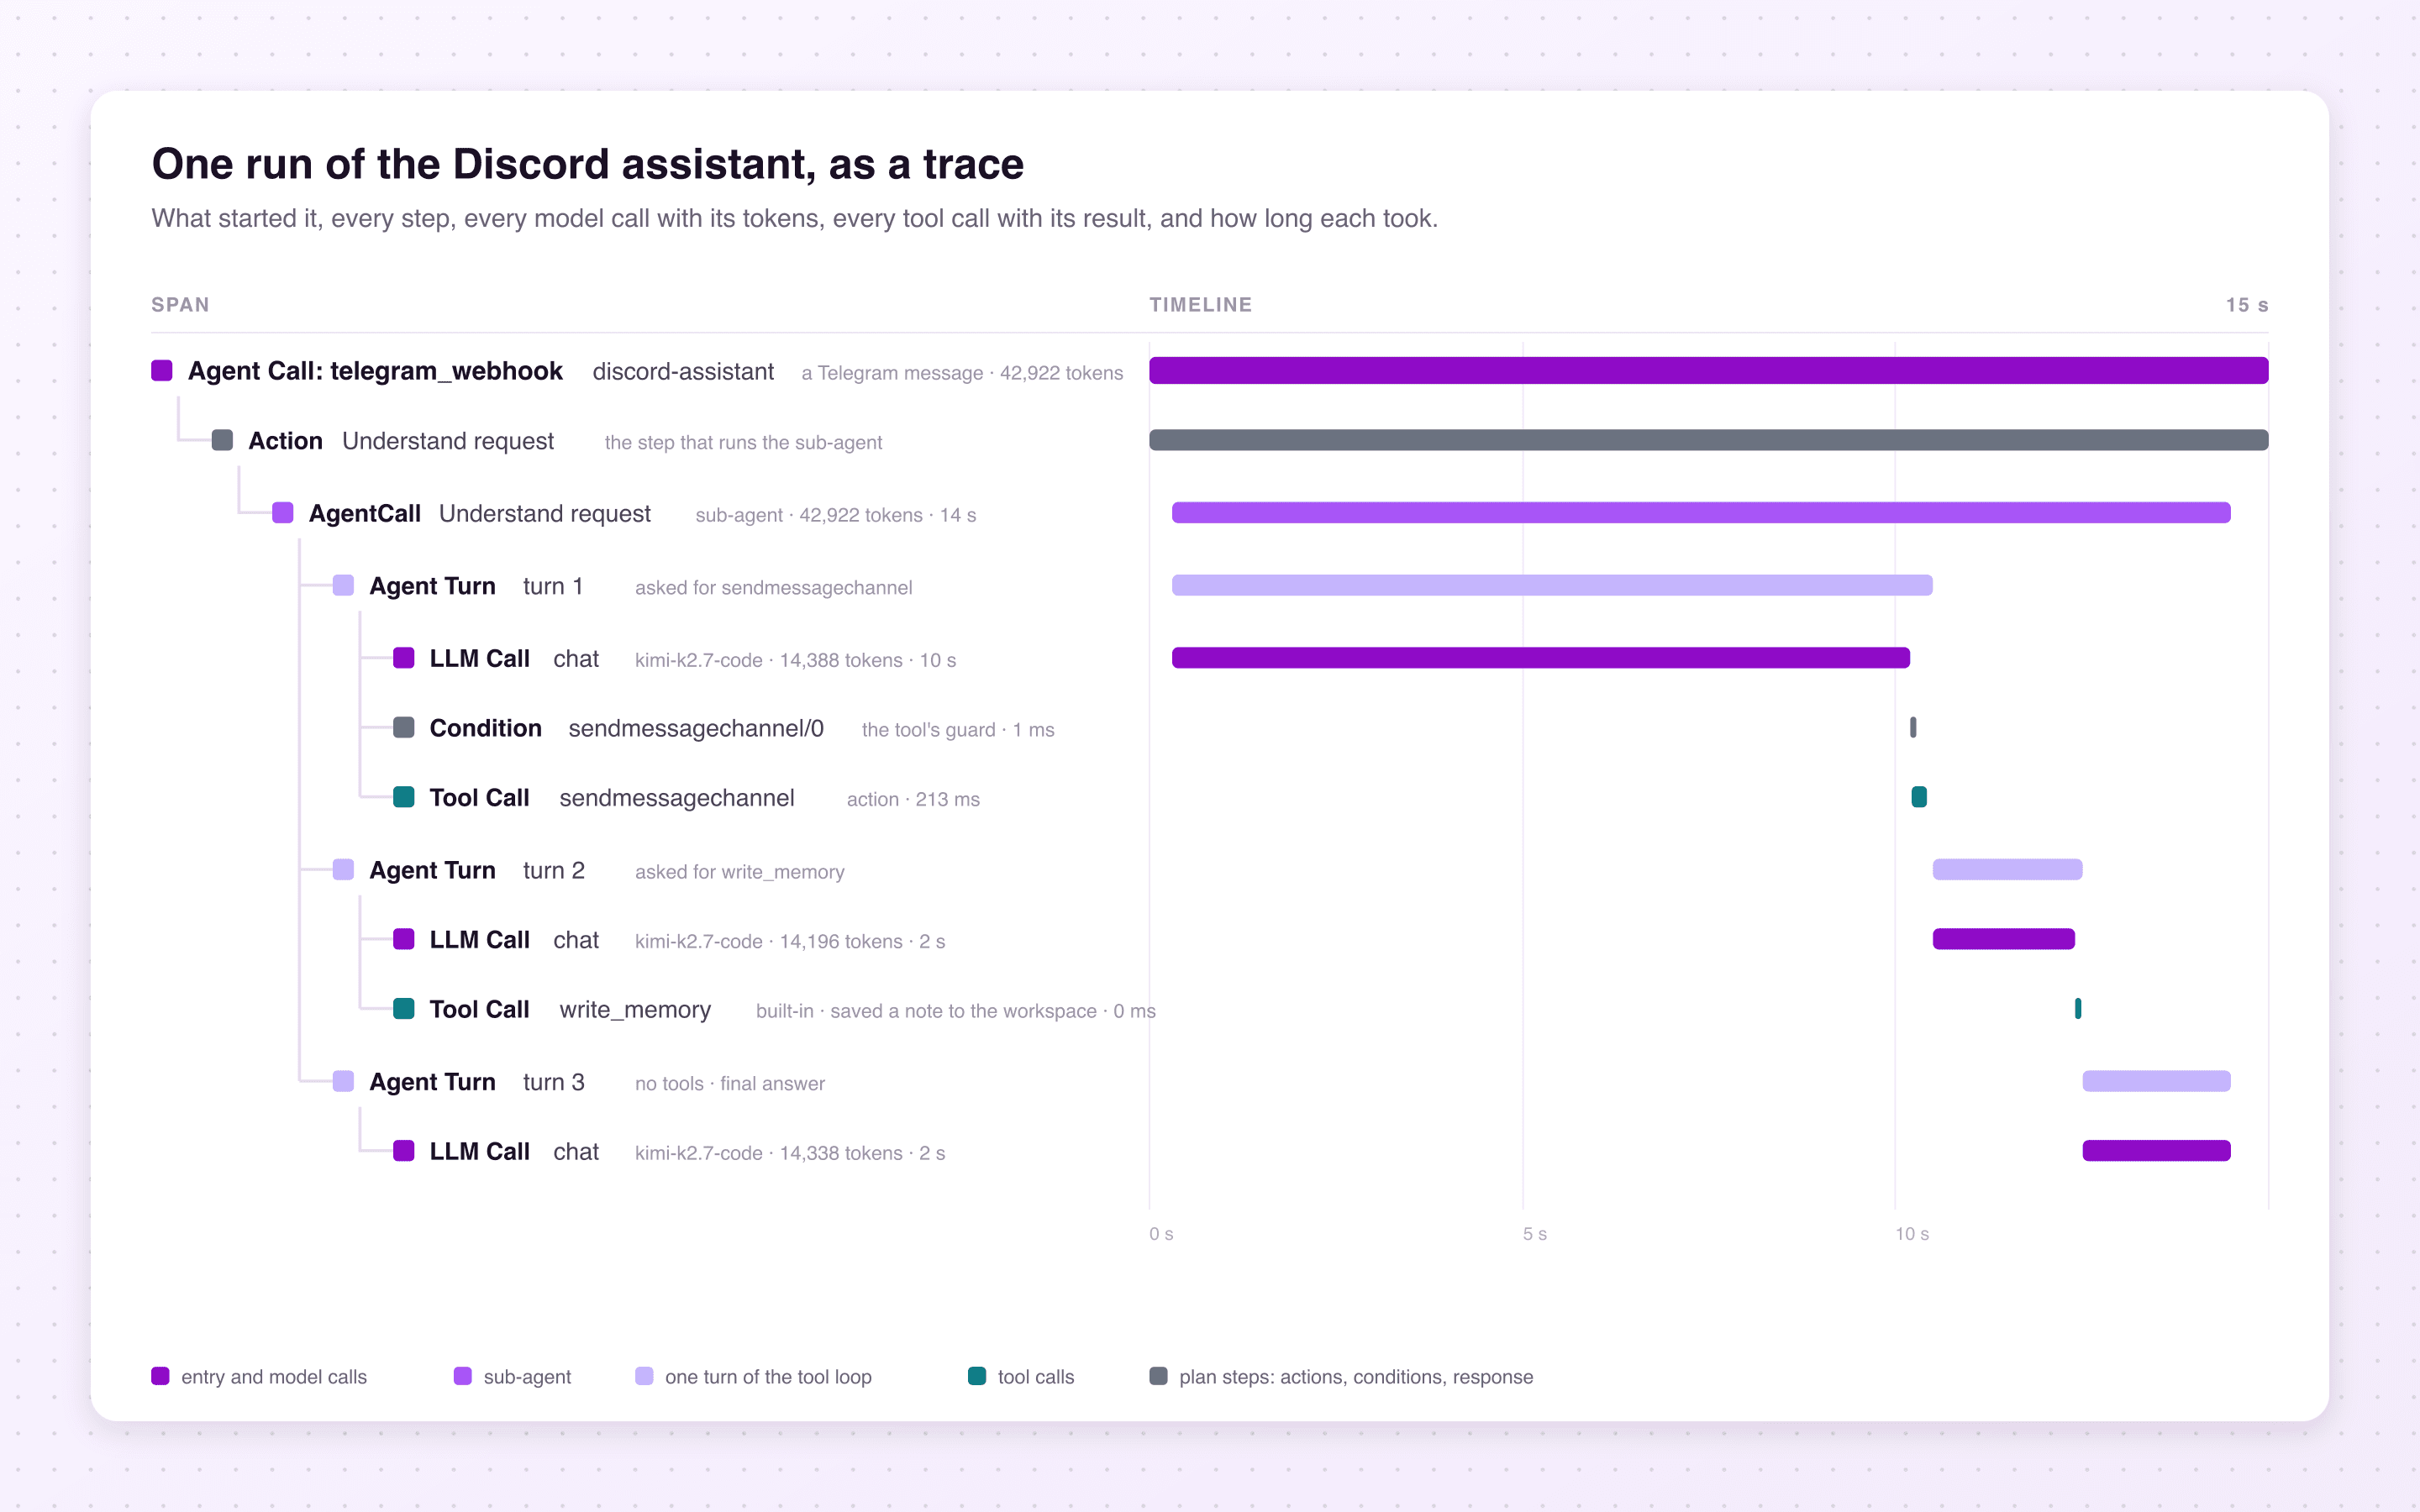
 Servflow Team
Why agents need traces
An agent does not run the way a service does. A request to a service calls a function, which calls others, in an order written down in code. A request to an agent starts a loop. The model reads what it has, decides whether to call a tool and which one, reads the result, and decides again. Each decision is made with the results of the ones before it. Sometimes a decision hands part of the work to another agent, which runs a loop of its own. The path is chosen as the run happens, so two requests to the same agent can take different paths and both be correct.
That is what makes the output a poor record of the run. The same answer can come from a good path or a bad one. A good path can produce a wrong answer when a tool returns something unexpected. If you want to know whether the agent did what you intended, you need the path, not the answer.
Logs do not give you the path. A log is a flat list of lines, ordered by time, from every component at once, mixed across whatever requests were running. You can grep your way back to one run, but the structure is gone. You cannot see which tool call belonged to which model decision, or how long the deciding took against the doing.
A trace is the opposite shape. It is one tree per run. Each step is nested under the step that caused it. Each step has a start, an end, what went in and what came out. Read top to bottom, it is the run as it happened.
For an agent, that tree answers the questions you actually have:
- Which tools were called, with what arguments, and what did they return?
- Which model call made which decision?
- Where did the time go, between thinking and doing?
- Where did the tokens go?
- Where did the run stop, and why?
It also changes how you improve an agent. A prompt change or a different tool design is a change to the path. The way to see whether it helped is to compare paths on real runs, and that is a comparison of traces.
What people have been saying
None of this is a ServFlow idea. Anyone who has run an agent in production arrives at the same place, and the public conversation over the last two years keeps returning to three threads.
The first is that the failures are in the sequence. Conventional monitoring shows that a request returned 200. It does not show that the agent looped twice, picked the wrong tool, or sent the right tool the wrong account. Nango's engineers put it plainly in a post on tracing agents with OpenTelemetry: the bug is usually in the tool call, and tracing your own service cannot see into it.
The second is lock-in. Early on, every agent framework shipped its own tracing, and each could only see itself. A trace from one framework could not be read by another, or by the tools your team already used for the rest of the stack. That pushed people toward a neutral format, the same way it had for ordinary services a decade earlier.
The third is privacy. A trace of an agent run is more sensitive than a trace of an HTTP request, because the interesting parts, the prompt and the tool arguments, are where customer data lives. The conversation about what to record has had to include what not to record.
The OpenTelemetry project's 2025 post on agent observability frames all three at once: fragmentation across frameworks and vendors, the need for shared conventions, and an open argument about whether instrumentation belongs inside the frameworks or in separate libraries. That argument is still going.
What OpenTelemetry settled on
OpenTelemetry is the vendor-neutral standard for traces, metrics and logs. The part that matters here is its semantic conventions: an agreed vocabulary of span names and attribute names, so a trace produced by one tool can be read by any other. Over 2024 and 2025 the project wrote conventions for generative AI and began extending them to agents. They are worth knowing in three parts.
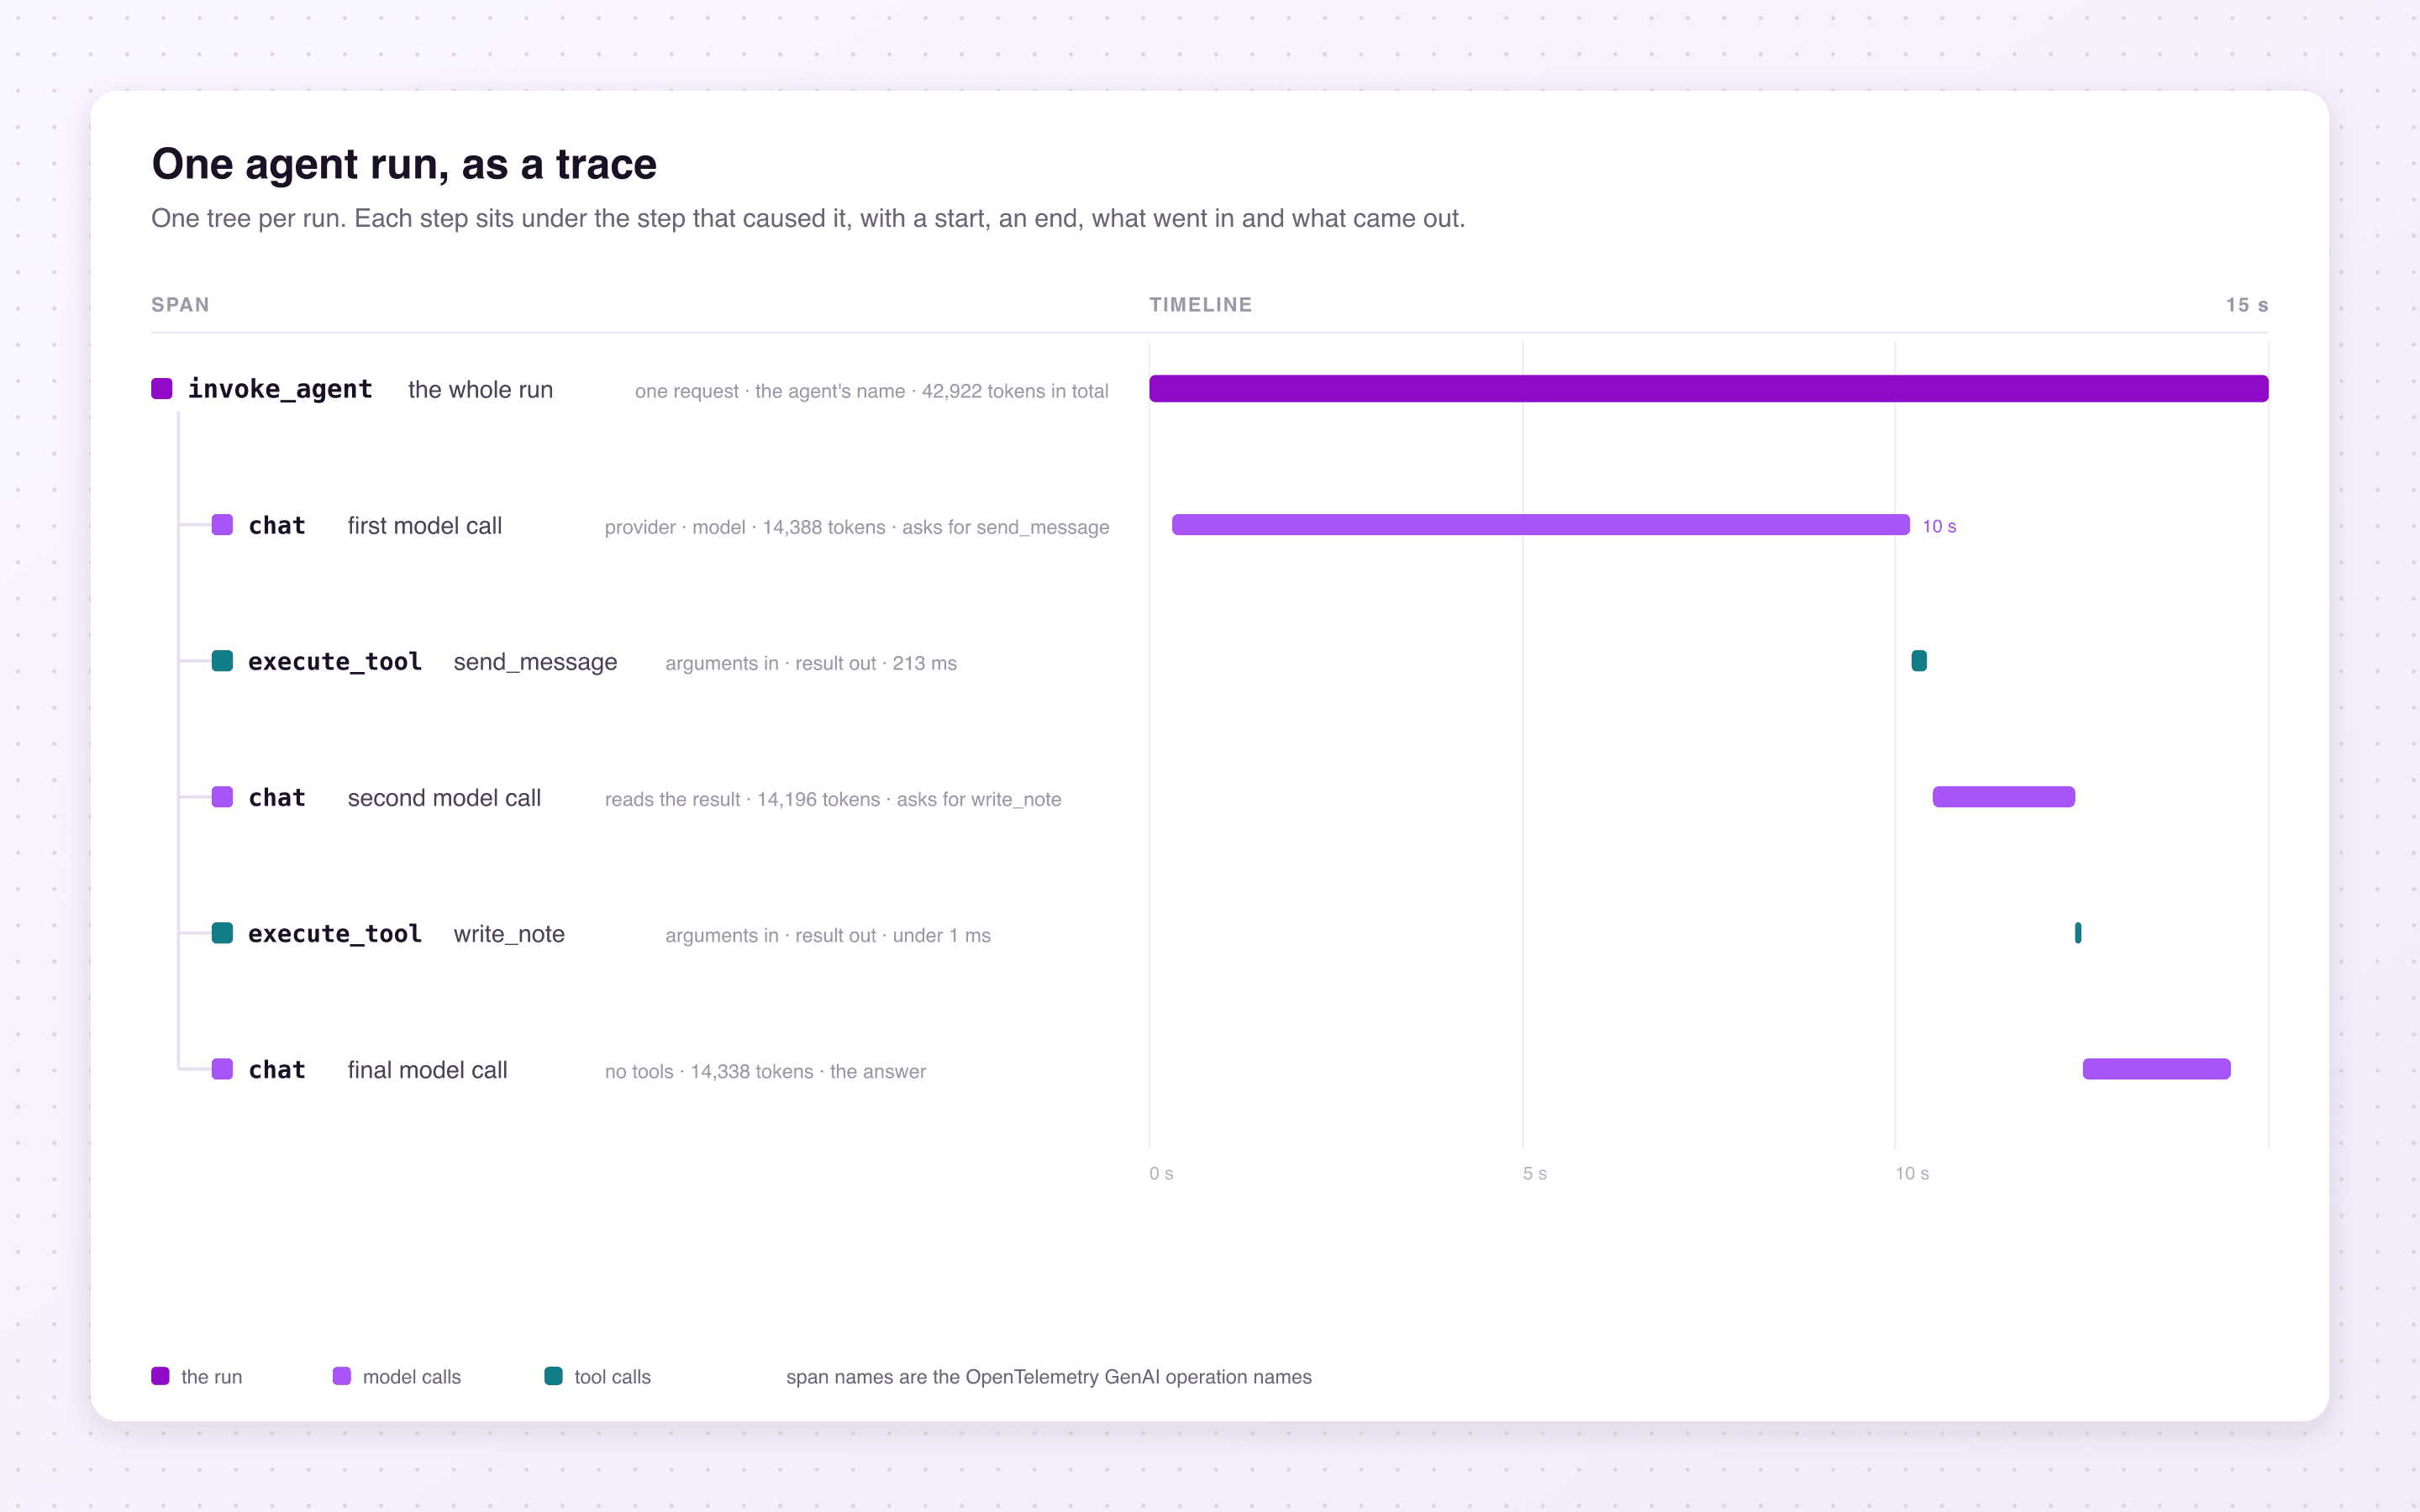
The shape. A run is a tree. At the root is an agent invocation, named invoke_agent. Under it, one chat span for each model call. Beside those, one execute_tool span for each tool call. A sub-agent is another invoke_agent inside the tree. That is the whole model, and it maps directly onto the loop described above.
What each span carries. A model call records the provider, the model that was asked for, the model that answered, and the input and output tokens. A tool call records the tool's name and kind, and an error type when it failed. An agent span records the agent's name. Everything sits under one gen_ai namespace, so a backend can find it without knowing which framework produced it.
What is off by default. Prompts, completions and tool arguments are not captured unless you turn capture on explicitly. The conventions treat message content as sensitive, because it routinely is.
Two honest notes. The conventions are still marked Development as of mid-2026, which means names can still change. The project's usual answer is to emit old and new names side by side during a transition. And the conventions define the shape of the data, not the policy. How long you keep traces, who can read them and what you redact are still your decisions.
The practical consequence is the point of the whole exercise. A trace in this shape can go to Grafana, Honeycomb, Datadog or anything else that speaks OTLP, and those tools already know how to group model calls and tool calls. The vocabulary is the portability.
What ServFlow does
If you already have an agent
Every run of a ServFlow agent is recorded as a trace in the shape above. There is nothing to add to the agent and nothing to instrument. Agents hosted on ServFlow cloud report automatically.
The tree in the viewer is the tree from the conventions: an agent invocation at the root, a model call for each time the model was asked, a tool call for each tool it used, with provider, model and tokens on the model calls and arguments and result on the tool calls. ServFlow adds one level the conventions do not have. Each turn of the tool loop gets a span of its own, grouping one model call with the tools that call asked for, so you can see which tool runs belonged to which decision instead of reading them as a flat list.
Turning it on
On ServFlow cloud, tracing is on. Traces are part of the Starter and Pro plans. On Free, the Traces page tells you the plan does not include them, so enabling tracing is an upgrade.
Reading the screen
Open Account → Traces in the dashboard.
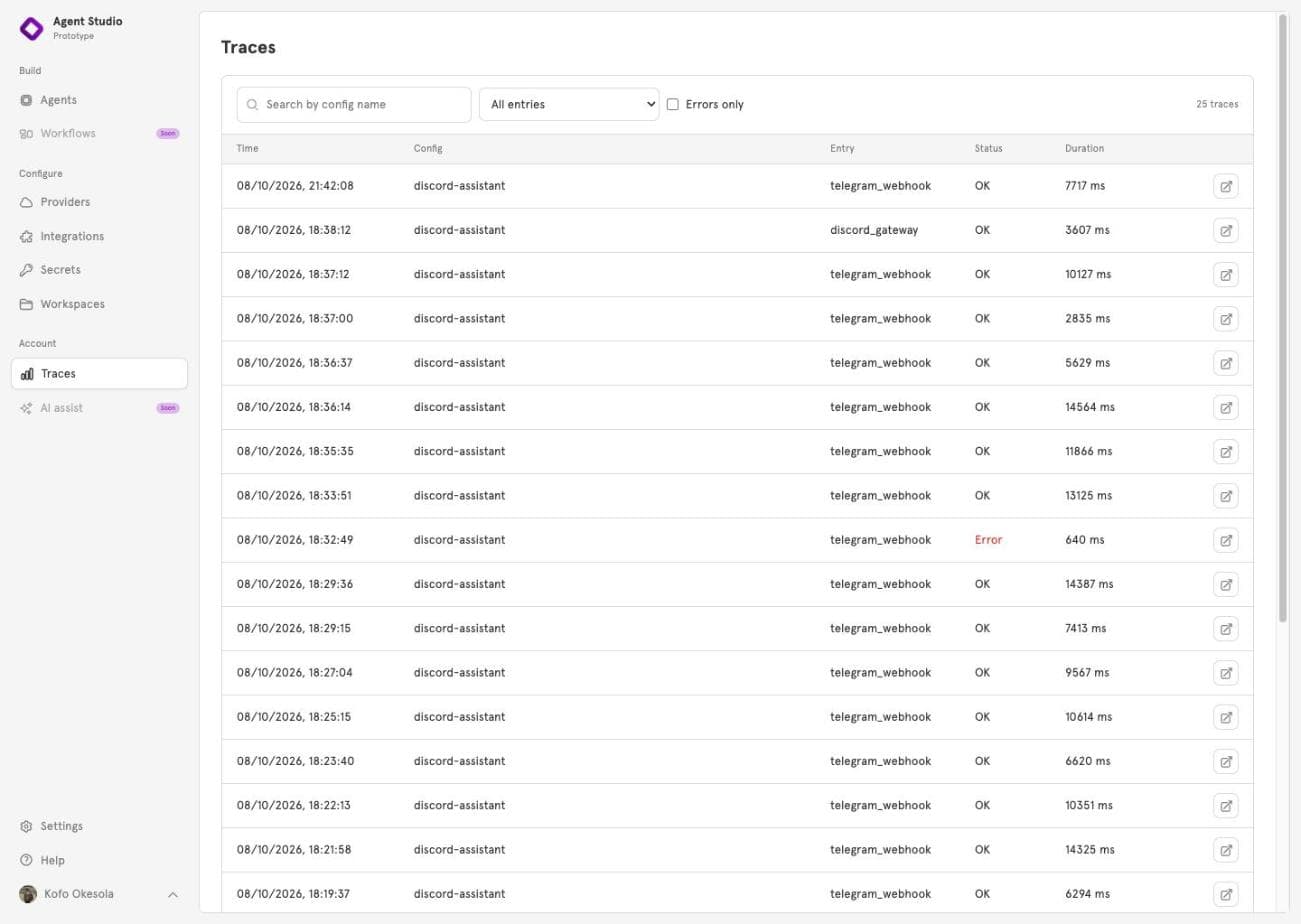
The list is one row per run: the agent, the entry it came through, its status, how long it took, and when, newest first. Search by agent, filter by entry to see only webhook deliveries or only scheduled runs, or tick Errors only. Runs are kept for 30 days. This answers the first question: what ran, and did it fail.
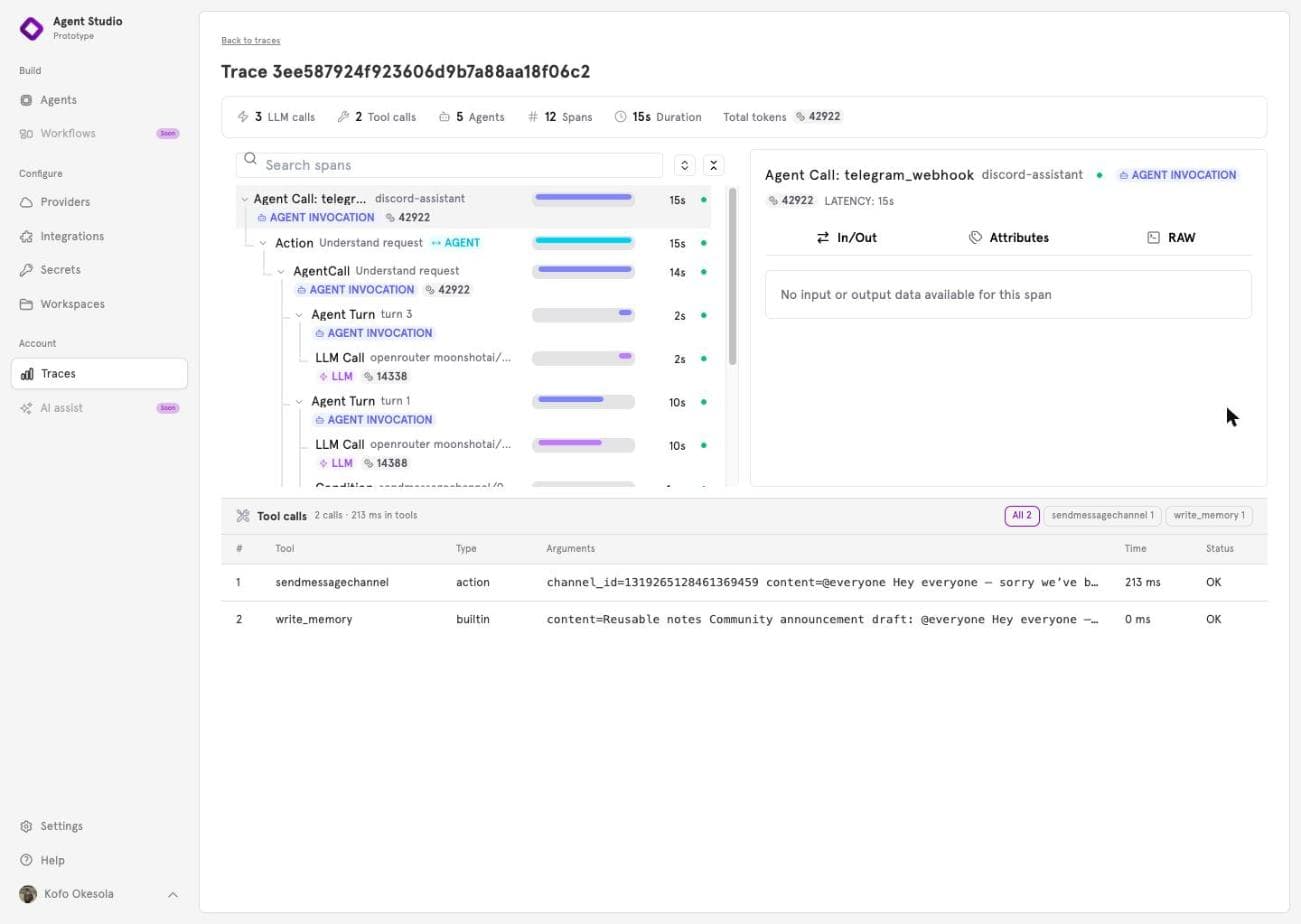
Open a row. The summary bar counts the model calls, tool calls, spans, time and tokens. The tree is the run. The details panel shows the selected step, with its attributes and the raw span behind it.
Select a model call.
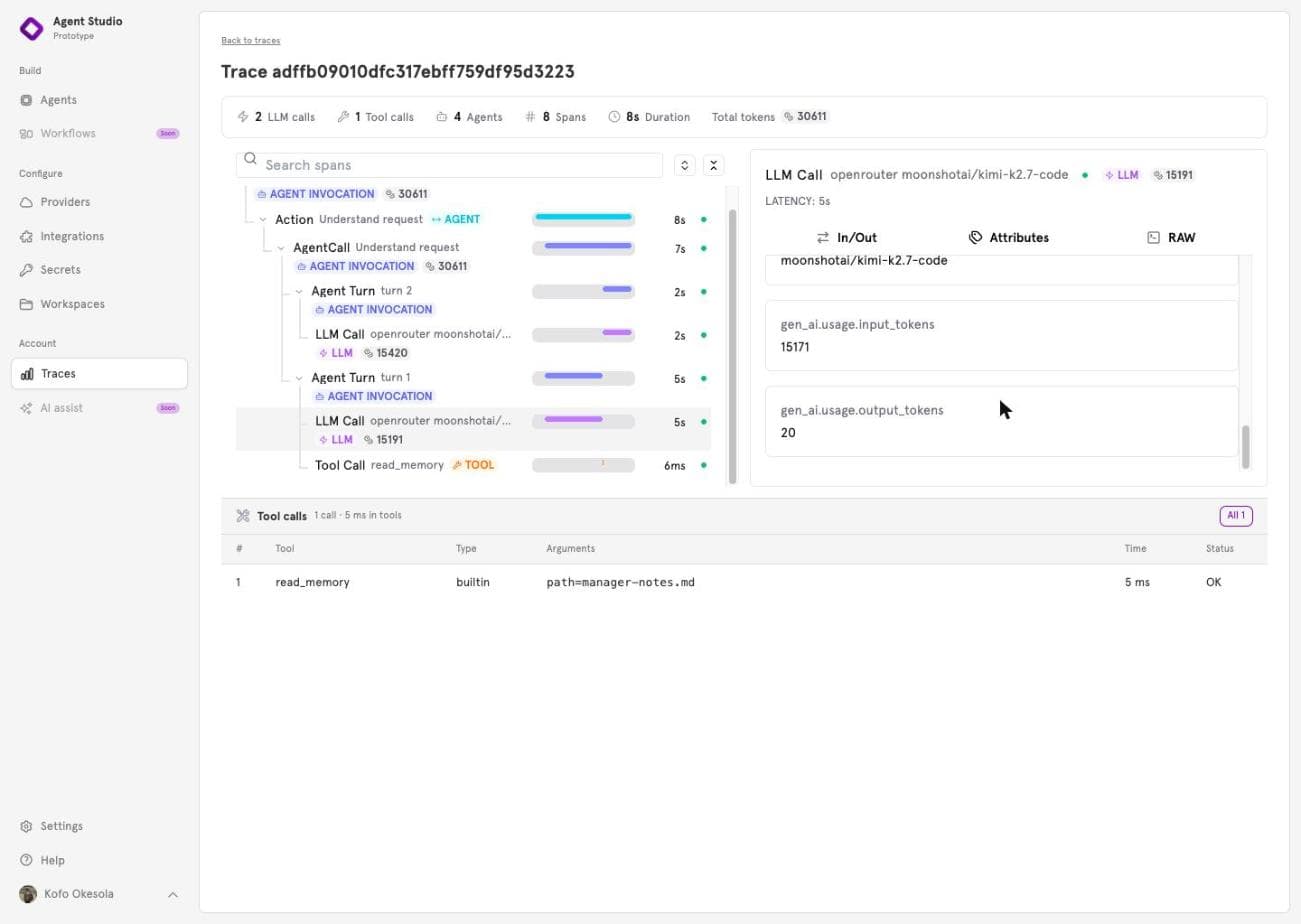
Provider, model, input and output tokens, duration. This is where the tokens and the time went.
Select a tool call.
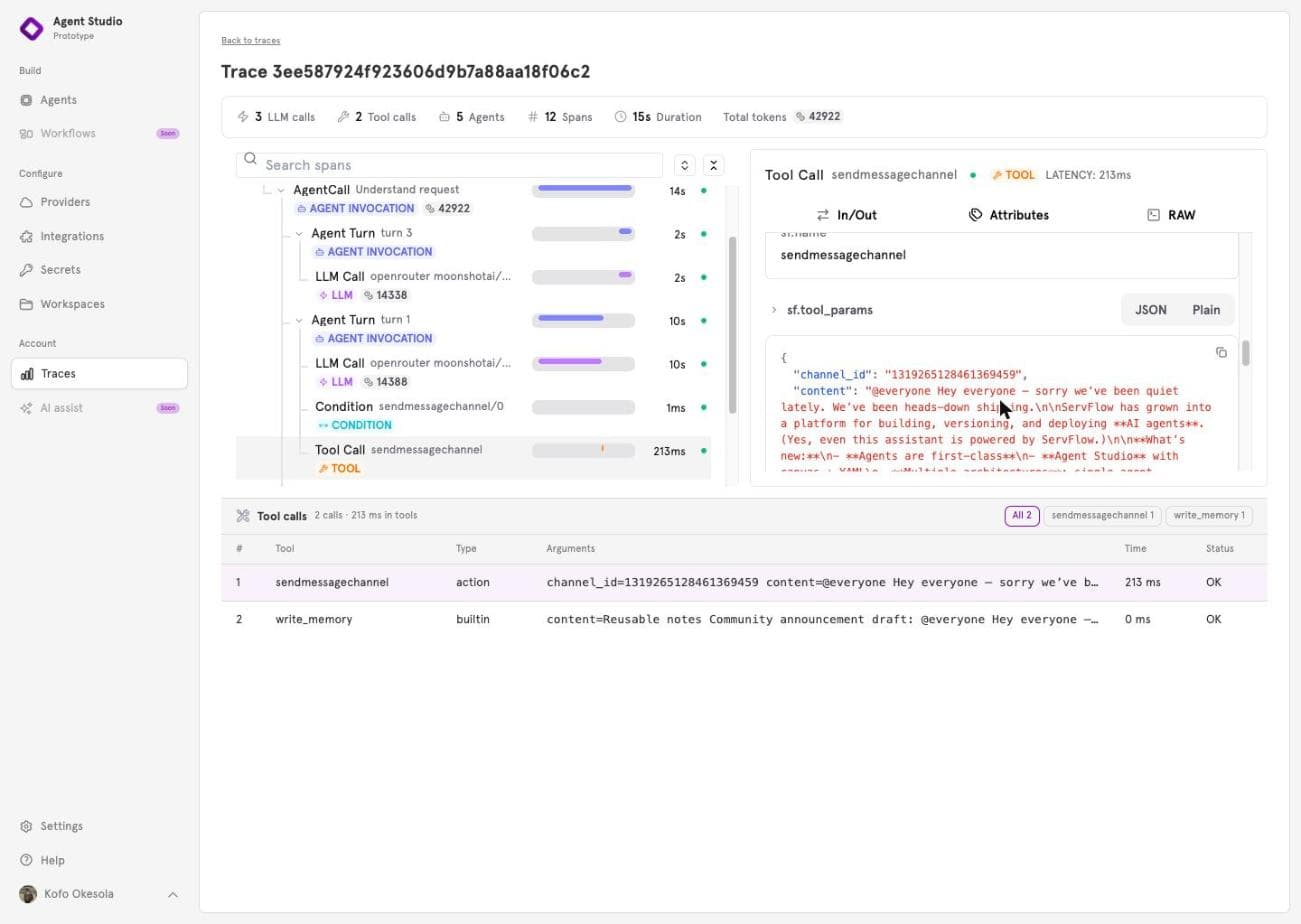
The arguments are what the model decided to send. Further down, the result is what the agent saw next.
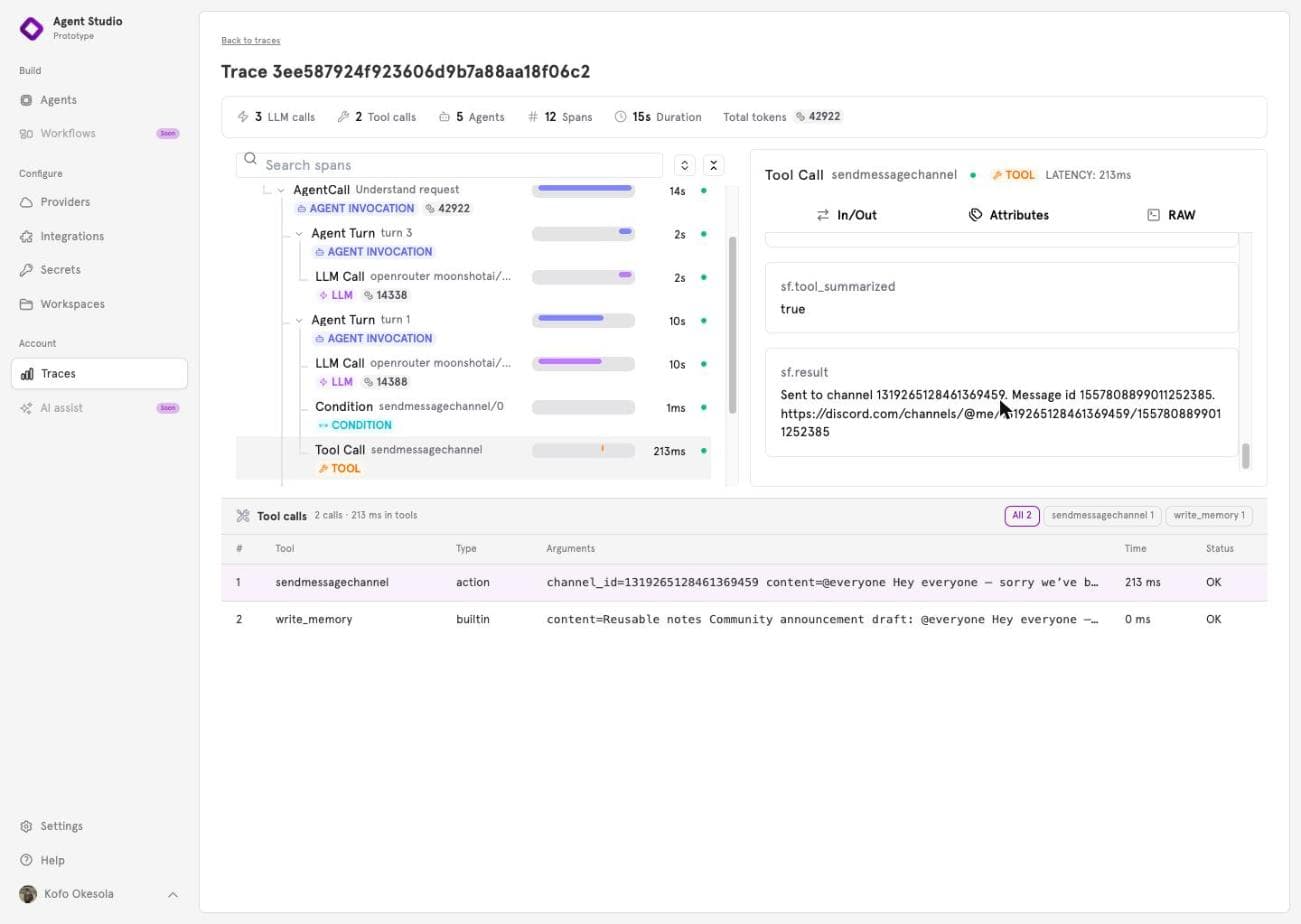
This is the view the "bug is in the tool call" thread was asking for: not that the tool was called, but what it was asked and what it said back.
Below the tree, the Tool calls panel lists every call in the run in order, with its duration and the total time spent in tools. Chips filter to one tool or to failed calls. A click selects the call in the tree.
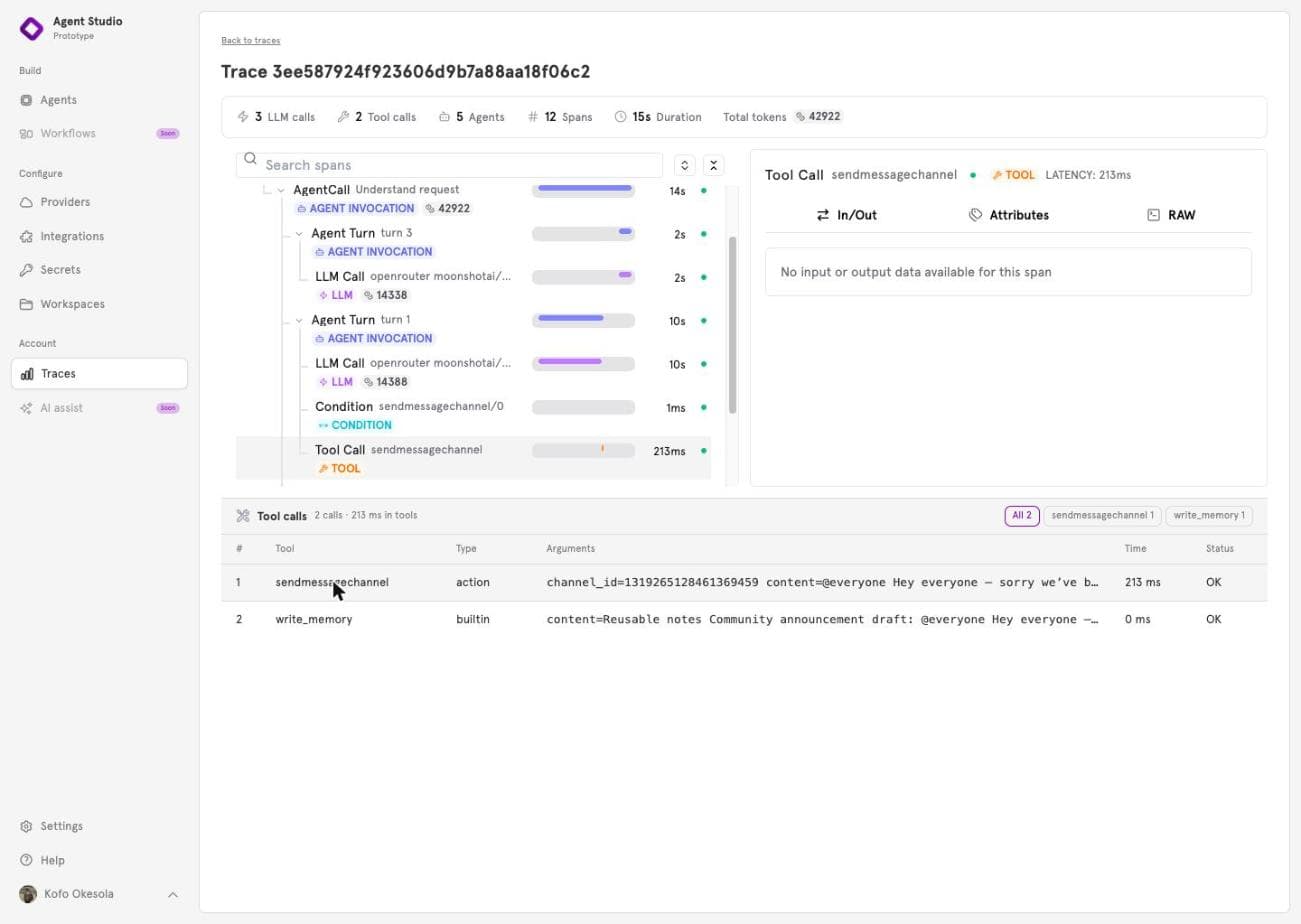
On a run with twenty calls, which one was slow is answered without expanding anything.
Tick Errors only on the list.
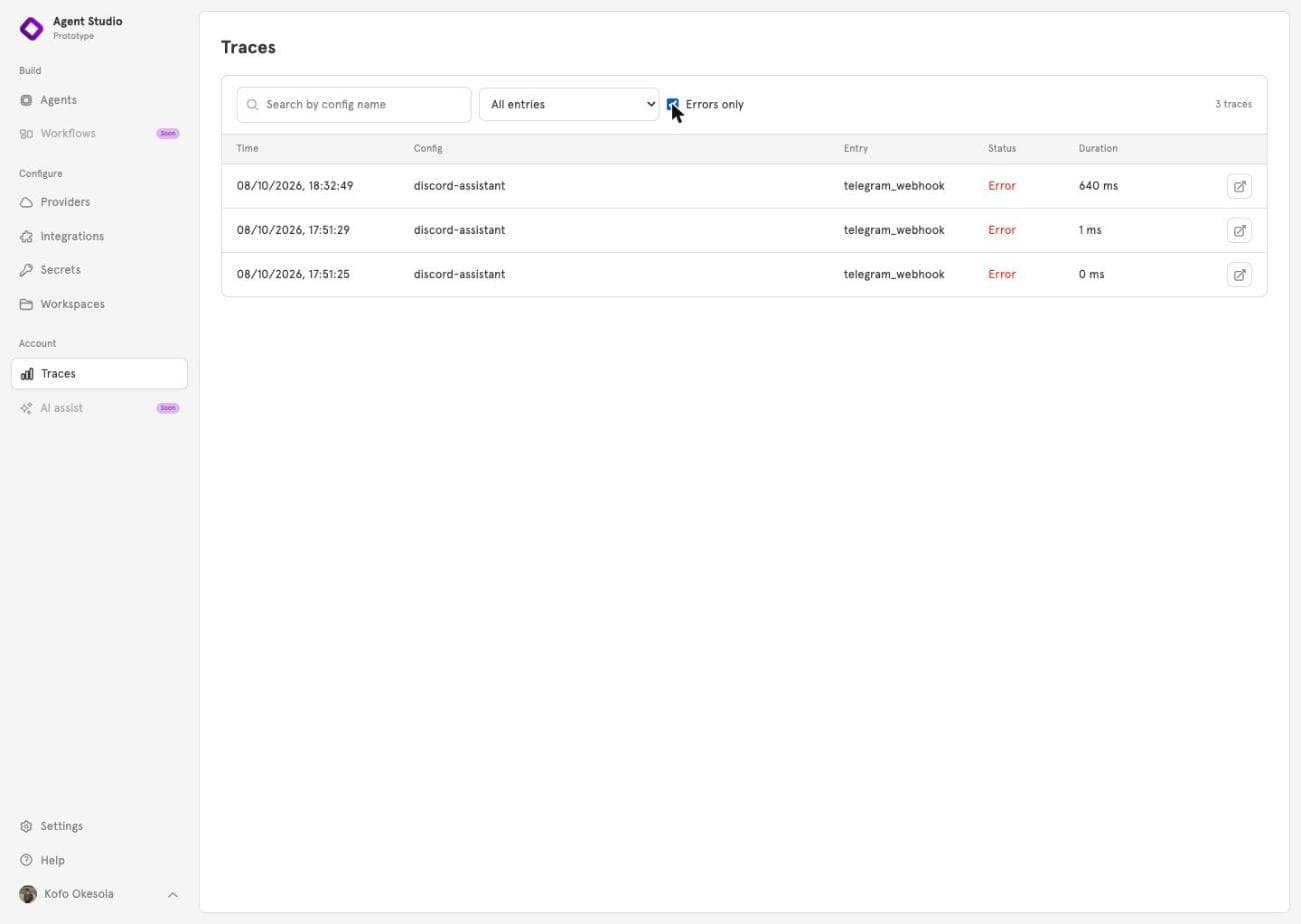
Open one. The step that failed is flagged, and so is every step above it, so you find it from the top. The details show the error.
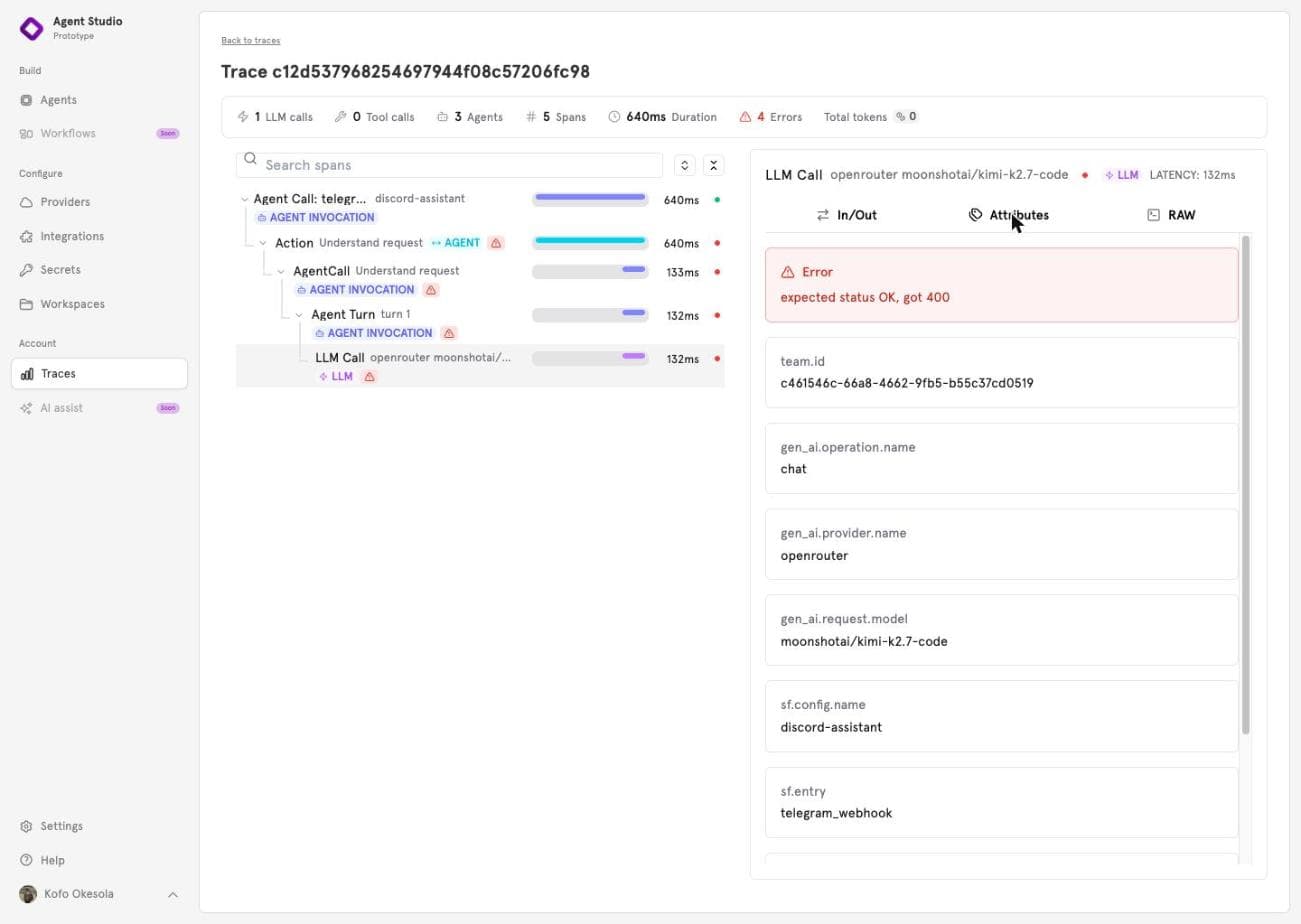
In this run the model call itself failed, a 400 from the provider, and nothing ran after it. A failed tool call looks different: the error goes back to the model as the tool's result, and the next turn shows what it did about it.
Three things are never in a trace. Secrets and integration tokens the run used are removed before it is recorded. Prompts are not recorded. Large tool outputs are capped and sensitive arguments redacted. That is the conventions' default, kept.
Start with the newest row
An agent's answer is the end of a path. The trace is the path. The industry has agreed what that record should contain, and every ServFlow run already produces one. Open Account → Traces, pick the newest row, and read the turns in order.
Sign up